.avif)
Try it now!
Managing your investments has never been easier!


The average hedge fund collects 1.5% of assets per year plus 17% of profits. For that price, you get access to seven classic playbooks that ETFs can now replicate at 0.50% or less. The math has changed since Alfred Jones launched the first long/short fund in 1949. A portfolio without these tools is like driving with summer tires through winter, you may still get there, you just slide through every drawdown. So which strategies still earn their keep, and which can a normal investor copy from a brokerage account?
Hedge funds use seven core strategies: long/short equity, event-driven, global macro, relative value, equity market neutral, quantitative, and emerging markets. Each one targets a specific market inefficiency. In 2026, most are available through liquid alternative ETFs or factor-based mutual funds at a fraction of the traditional 2-and-20 fee structure. Pick by the inefficiency you want to exploit, not by the fee structure.
Hedge funds are not a single asset class. They are a set of approaches that try to deliver returns uncorrelated with the S&P 500.
The point is not higher returns. It is different returns. A long/short fund can earn 7% in a year when the index drops 20%, or it can lag the index in a bull market. The job of the strategy is to do something other than what the rest of your portfolio is already doing.
Why this matters in 2026:
For a private investor with $250k to $5M in investable assets, the right allocation to alternatives is usually 5% to 15%. Below 5%, the impact on the portfolio is too small to matter. Above 15%, the complexity and fees outweigh most of the benefit.
Each strategy below includes the mechanism, who it suits, and how to access it in 2026 without writing a $1M check.
The original hedge fund strategy, pioneered by Alfred Jones in 1949. Buy stocks you expect to outperform. Short stocks you expect to underperform. The net market exposure is much lower than a long-only portfolio.
Mechanism: Pick winners and losers within the same sector. If Coca-Cola is undervalued relative to Pepsi, go long Coke and short Pepsi. The bet is on the spread, not on the market.
Best for: Investors who want equity exposure with reduced beta. Particularly useful late in a bull cycle.
How to copy it in 2026: ETFs like AGFiQ U.S. Market Neutral Anti-Beta (BTAL) deliver a directional long/short exposure at a 0.95% expense ratio. Long/short mutual funds from Vanguard (VLSAX) and AQR target similar exposure with broader baskets.
Mergers, spinoffs, bankruptcies, and restructurings create temporary pricing inefficiencies. Event-driven funds buy when a deal is announced, pocket the spread when it closes.
Mechanism: When Company A announces it will buy Company B at $50 per share, Company B's stock usually trades at $48 to $49 until the deal closes. The 2% to 4% spread is the event-driven return.
Best for: Investors who want bond-like, single-digit, lower-correlated returns when bonds themselves are not delivering.
How to copy it in 2026: IQ Merger Arbitrage ETF (MNA) tracks the merger spread universe at a 0.77% expense ratio. The strategy works best in environments with steady deal flow, which 2026 has so far delivered.
The strategy of betting on the direction of currencies, interest rates, and commodities based on macroeconomic analysis. Stanley Druckenmiller, Ray Dalio, and George Soros all built reputations on global macro.
Mechanism: If you believe the Bank of Japan will tighten faster than the market expects, you short the yen against the dollar. If you think the Fed will cut faster, you buy long-duration Treasuries. The trades are usually expressed through futures and options for capital efficiency.
Best for: Investors who can sit through long flat periods waiting for a regime change. Global macro shines during inflection points, looks asleep otherwise.
How to copy it in 2026: WisdomTree Managed Futures Strategy Fund (WTMF) and Invesco Optimum Yield Diversified Commodity (PDBC) give retail investors exposure to systematic macro plays. Expense ratios sit between 0.65% and 0.95%.
Two related securities should trade at a stable spread. When they don't, the spread becomes the trade.
Mechanism: A convertible bond should be worth its conversion value plus its bond value. When the market misprices either component, a relative value fund buys the cheap leg and shorts the expensive leg.
Best for: Investors who want returns that look almost nothing like the stock market. Relative value drawdowns happen in liquidity crises, not in equity selloffs.
How to copy it in 2026: SPDR SSGA Multi-Asset Real Return ETF (RLY) and similar liquid alt mutual funds approximate the exposure. Pure relative value is harder to replicate outside the institutional channel, accept that the retail version is the diet version.
A subset of long/short with a stricter rule: the dollar value of longs equals the dollar value of shorts at all times.
Mechanism: Long $1M of cheap stocks, short $1M of expensive ones. Net market exposure is roughly zero. Returns come entirely from stock selection.
Best for: Investors who want bond-like volatility and bond-like correlation, but believe their equity-picking factor (value, quality, momentum) is real.
How to copy it in 2026: Vanguard Market Neutral Fund (VMNFX) is a low-cost option at a 0.55% expense ratio. Factor-tilt ETFs like iShares MSCI USA Value Factor (VLUE) deliver part of the same benefit without the short side.
Computer-driven strategies that scan thousands of stocks, rank them by statistical patterns, and trade automatically.
Mechanism: Most quant strategies are factor exposures, value, momentum, quality, low volatility, applied at scale. The flagship quant funds (Renaissance, Two Sigma, AQR) add proprietary signals and machine learning, but the foundation is factors.
Best for: Investors who trust math more than narrative. Quant funds tend to underperform during regime shifts and outperform during stable periods with persistent factor returns.
How to copy it in 2026: Factor ETFs from iShares (USMV, QUAL, VLUE, MTUM) cost 0.15% to 0.30%. They deliver the same statistical exposures the big quant funds chase, without the 20% performance fee.
Funds focused on equity, debt, or currency markets outside the developed world. China, India, Brazil, Indonesia, and Mexico are the dominant exposures.
Mechanism: Emerging markets trade at structurally lower valuations than developed markets because of political risk, currency risk, and lower liquidity. Active EM hedge funds try to harvest the risk premium without the worst tail outcomes.
Best for: Investors who already hold US and developed market exposure and want a return profile that depends on different economic cycles.
How to copy it in 2026: iShares MSCI Emerging Markets (EEM) and Vanguard FTSE Emerging Markets (VWO) give passive exposure at 0.07% to 0.68%. For deeper coverage of regional ETF picks, see global diversification with ETFs. Active EM funds from Matthews Asia or J.P. Morgan add country selection at higher fees.
A hedge fund's fee structure has historically been "2 and 20", a 2% management fee plus 20% of profits. The actual industry average in 2025 sat closer to 1.5% and 17%, but the principle is the same: fees eat a third of gross returns over time.
Three ways to get the strategy without the fee load:
Liquid alternative ETFs. Funds like BTAL, MNA, WTMF, and QAI replicate single-strategy hedge fund exposures with daily liquidity, expense ratios under 1%, and no performance fees. They will not match the best 5% of hedge funds. They beat the median hedge fund after fees most years.
Factor ETFs. USMV, MTUM, QUAL, VLUE, and similar deliver the underlying statistical exposures that most quant hedge funds chase. The systematic part of hedge fund returns is now commoditized.
Multi-strategy mutual funds. AQR, Goldman Sachs, and PIMCO sell mutual funds that bundle several hedge fund strategies into a single ticker. Higher costs than ETFs (0.80% to 1.40%), but no separate performance fee.
Hypothetically, a $500k portfolio paying 1.5% on a 10% alternatives allocation pays $750 a year in management fees. The same allocation through liquid alt ETFs at 0.75% costs $375. The 20% performance fee on top of the 1.5%, in a year when the fund returns 8%, costs another $800. Total drag in the traditional structure: roughly $1,550 per year on the alternatives sleeve alone.
Before any allocation, run this 5-point checklist:
Where 8FIGURES fits: If your assets are spread across 6 to 10 accounts, the first problem with adding alternatives is visibility. 8FIGURES helps by showing brokerage accounts, retirement accounts, crypto, real estate, and private investments in one place. That makes it easier to see whether a new long/short or merger-arb position actually reduces portfolio risk, or just adds another expensive line item. The same framework applies to portfolio diversification for high net worth investors.
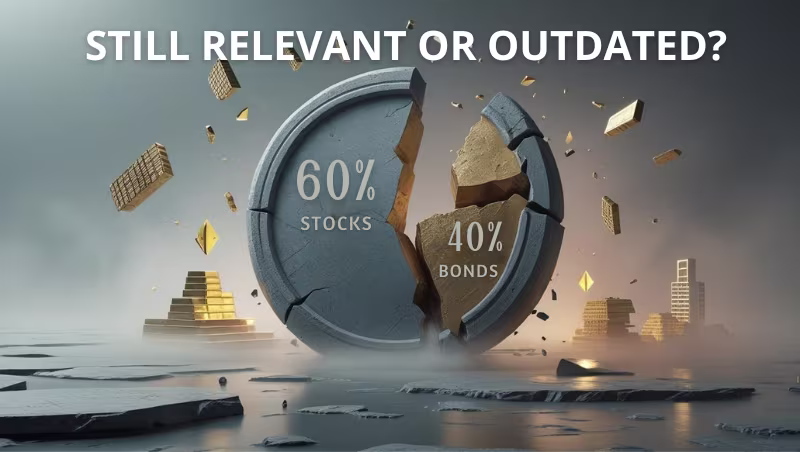
For the right allocation, yes. The strategies themselves are not magic, they exploit specific inefficiencies. What has changed is access: most strategies are now available through liquid alternative ETFs at 0.50% to 1%, instead of the traditional 1.5% management plus 17% performance fee. The 2026 case for alternatives is stronger because stock-bond correlation has been positive for two of the last three years.
Direct hedge fund investment usually requires accredited investor status ($1M net worth excluding primary residence, or $200k income for two consecutive years). But liquid alternative mutual funds and ETFs are open to everyone. The strategy is the same. The wrapper is more accessible.
A reasonable range is 5% to 15% of investable assets. Below 5%, the diversification benefit is too small to notice. Above 15%, fees and complexity start to outweigh the benefit. Yale and Harvard endowments allocate 20% to 35%, but they have institutional liquidity that private investors do not.
Managed futures ETFs like WisdomTree's WTMF (0.65% expense ratio) and KFA Mount Lucas Index Strategy ETF (KMLM, 0.92%) systematically trade currencies, rates, and commodities. They do not match the best discretionary macro managers in a great year. They cost a fraction over a decade.
Imperfectly. Liquid alt ETFs typically capture 60% to 80% of the strategy return profile, because daily liquidity rules out the illiquid trades that drive a portion of hedge fund alpha. The trade-off is reasonable, you accept slightly lower returns in exchange for transparency, daily pricing, and no lockups.
Originally published August 15, 2025. Updated May 15, 2026.
Managing your investments has never been easier!